HyperC P34 preview
Tabular model for profit targets.
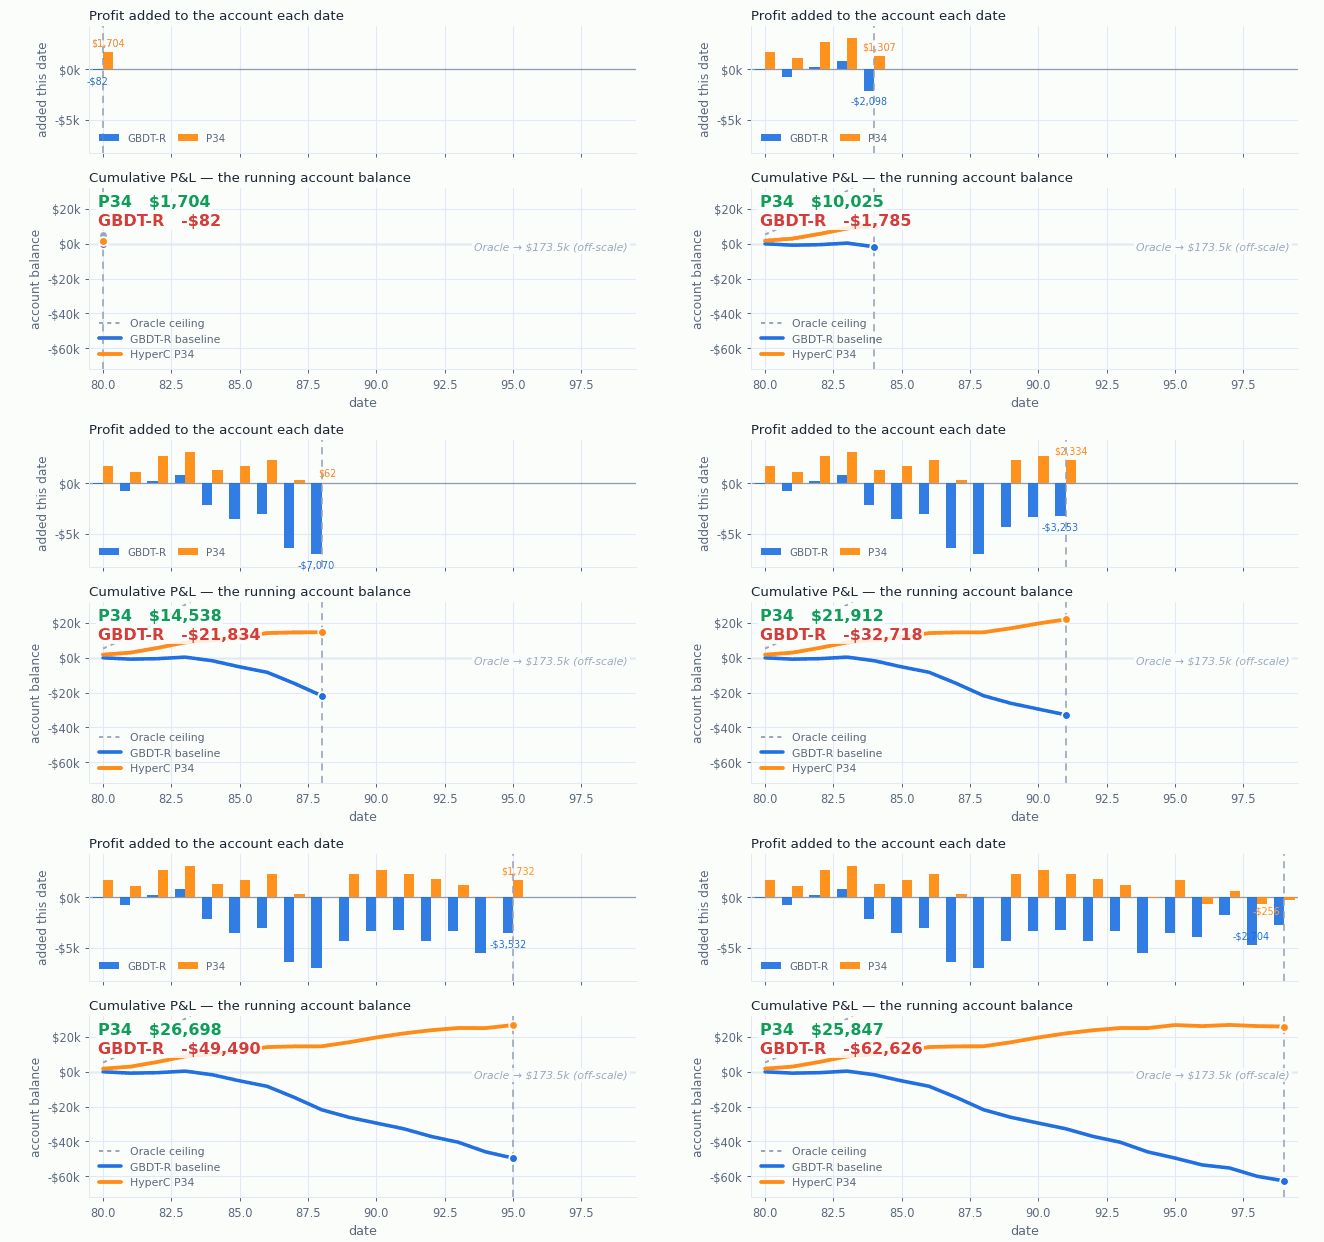
P34 is a Profit-as-Regression model — PARML, Profit-as-Regression Machine Learning — that turns the deals in front of you into a portfolio. It answers one question: given the trade options available right now, which should you take, at what size, and what profit should you expect?
It is intended as a replacement for naive tabular data fitting, which is trained only on the deals a business actually took and therefore tends to be too optimistic on real-world markets (above plot). The deals P34 refuses are as much of the output as the ones it takes.
This is a condensed brief. The complete, versioned documentation is hyperc-ai/P34-API-DOCS, and the product site is hyperc.com. The HyperC platform is in beta: capabilities, markets and limits change as it develops.
Addresses
| What | Where |
|---|---|
| API | https://api.hyperc.com/v1/ |
| Management console — account, API keys, plans, session status | api.hyperc.com/app/ |
| Documentation | github.com/hyperc-ai/P34-API-DOCS |
| Technical report & notebooks | github.com/hyperc-ai/p34-technical-report |
| Markets catalogue — 69 markets, with states | hyperc.com/markets.html · markets.json |
GET /v1/ is open and needs no key — it returns the protocol, the model versions the server currently offers, and the endpoint list. It is the authoritative answer to “what does the API do today”; everything below is a reading of it.
The contract
You send two tables, a config and a business description, and receive back one predicted menu.
menus— every trade option you faced, historically and right now. One row per (key, quantity option). The historical rows are context: P34 is pre-trained, so fitting on your history calibrates it to your market rather than teaching it markets from scratch.sales— your realized sales log. Used to ground the history: your inventory economics (holding costs, write-offs, fees) are replayed to reconstruct what every historical option would have earned.market_type— the grounding configuration for those economics.business_description— free text describing the business and how its unit economics is computed. Under the default grounding mode this text is compiled into the economics that reconstruct your history, so it is executable input, not documentation. Send it per request, or save it once in the console.
The task is the menu you want decided now. It is marked two ways at once and both must agree: T = 0 and menu = 0. Every historical menu uses a non-zero id. Task rows must carry no outcome values — a non-blank profit on a T = 0 row is rejected with 422. P34 never sees your future.
menus  (one row per key x quantity option)

  key   | menu |  T  | unit_cost | unit_price | qty | profit
 -------|------|-----|-----------|------------|-----|--------
  A001  |  112 | -12 |     15.50 |      32.51 |   1 |  -1.55   history
  A001  |  112 | -12 |     15.50 |      32.51 |   2 |          (menu != 0)
  A001  |  112 | -12 |     15.50 |      32.51 |   3 |
  A001  |    0 |   0 |     15.20 |      33.10 |   1 |          task
  A001  |    0 |   0 |     15.20 |      33.10 |   2 |          (T = 0)

                              |
                              v

  key   | qty | profit
 -------|-----|--------
  A001  |   2 |  42.70     take two
  A002  |   0 |   -1.20    refuse
The rows of a menu are mutually exclusive choices, not independent predictions: at most one quantity is selected per key-date. Two rows with different unit_cost in the same key-date group are two competing supplier quotes, and at most one is picked.
The menus table
| column | req. | meaning |
|---|---|---|
key | yes | asset identifier — SKU, ASIN, contract id, applicant id. Strings are fine; they are re-coded internally and mapped back in the response. |
menu | yes | menu id. 0 = the task menu. History: any non-zero id, one menu per decision moment. Each historical key appears in exactly one historical menu. |
T | yes | time. 0 = now, negative = past periods, in any consistent unit. |
T_lead | no | lead time in the same units: how long before a sale can start. |
| features… | — | any number of feature columns. More useful features is better. |
unit_cost | yes | per-unit landed cost. Numeric on every row. |
unit_price | yes | per-unit selling price. Older prices go in as unrolled features: price_T-1, price_T-2, … |
qty | yes | the deal size this row represents — counts or floats, but not a mixture within one dataset. A mutex within the key-date group. |
*stock* | no | any column matching the wildcard: the position already held for this key. Positions exit FIFO. |
qty_outstanding_T+N | no | inventory arriving in N time units and not yet sellable. |
historically_available | no | 1/0 — was this option actually on the table. 0 marks an option you priced but could not have taken (MOQ, pack size). Omit the column and the whole history reads as real offers. |
historically_chosen | no | 1/0 — your previous policy: what the business actually took. Optional. Omit it when there was no previous business, or when a history assembled by research and replay has no decisions to record. |
profit | no | realized total profit of the decision. Marks the group as an observed outcome. The number itself is not trusted by default — the economics are replayed from sales. Must be blank on every T = 0 row. |
The history must be two-part. Some outcomes known, others genuinely enterable but never tested. A history in which every group is observed is refused outright — it says nothing about what a process refuses, and the gap between the two is where everything P34 does with selection bias lives. This is one of the working definitions of a computable market.
Try it with no account
POST /validate checks a complete /fit payload — structure, columns, the menu-0 rules, the volume floors — without grounding, queueing or charging anything, and needs no key at all:
curl -X POST https://api.hyperc.com/v1/validate \
     -H 'Content-Type: application/json' \
     --data @request.json
{"ok": true,
 "errors": [],
 "warnings": [
   {"code": "volume.floor", "severity": "warning",
    "detail": "only 1 historical menus (decision moments);
               the cluster needs at least 10"}],
 "counts": {"menus_rows": 36, "menus_keys": 6, "t0_rows": 18,
            "history_rows": 18, "menus": 2, "sales_rows": 1},
 "report": {"historically_chosen": "provided",
            "menus_groups_without_choice": 3, "...": "..."},
 "estimate": {"pricing_mode": "runtime",
              "labeled_rows_estimate": 18}}
It is the cheapest way to find out whether your data is shaped like a P34 problem: assemble one real menu, send it, and read the counts and the volume-floor warnings before anyone signs up for anything.
Submitting a fit
Get an API key from the management console (register → API keys). A test- key is issued automatically when a subscription activates, and on an agent-workspace VM the same key is placed on the machine at /workspace/.p34_api_key, so an agent can call the API with no copy-pasting. Send it on every request as Authorization: Bearer <key>.
import requests

H = {"Authorization": "Bearer " + api_key}
BASE = "https://api.hyperc.com/v1"

r = requests.post(BASE + "/fit", headers=H, json={
    "menus": menus,            # list of records, or base64 parquet
    "sales": sales,
    "market_type": {},
    "business_description": (
        "What the business is, and how its unit economics "
        "is computed: fees, holding costs, write-offs. "
        "Approximations are fine."),
})
session = r.json()["session_id"]
Fits are asynchronous. POST /fit returns in seconds; the calculation runs on HyperC's compute cluster and takes minutes. Poll until the status is terminal:
requests.get(f"{BASE}/result/{session}", headers=H).json()
POST /fit  ->  validation  ->  grounding  ->  queued
                              (minutes)         |
                                                v
GET /result/{id}  <-  processing  ->  done | failed
A done response carries the task menu, filled in:
{"status": "done",
 "menu": [{"key": "A001", "menu": 0, "T": 0,
           "qty": 3.0, "profit": 42.7},
          {"key": "A002", "menu": 0, "T": 0,
           "qty": 0.0, "profit": -1.2}],
 "n_selected": 1,
 "predicted_profit_sum": 42.7,
 "confidence_thresh_calibrated": 0.48,
 "confidence_sweep": [ ... ]}
One row per key: qty is the selected size (0 = do not trade) and profit the predicted total at that size. Take the qty > 0 rows together as the recommended book — the prediction is calibrated as a sum, not row by row. On the rc012 line a key absent from the response means the same thing as qty: 0.
Endpoints
| method & path | purpose |
|---|---|
GET / | Service info: protocol, model versions, endpoint list. Open. |
GET /health | Liveness probe. Open. |
POST /validate | Check a /fit payload without grounding, queueing or billing. No key required. |
POST /fit | Submit menus + sales + market_type + a resolvable business description. Returns a session_id. |
GET /result/{id} | Poll: grounding → queued → processing → done / failed. |
POST /predict | Instant selection from a small in-process reference model — a payload sanity-check while the real calculation runs. Not P34's answer; /result is. |
DELETE /session/{id} | Cancel a running fit you own and discard the session. |
GET /account/balanceGET /account/ledgerPOST /account/transfer | Token wallet: balance and monthly grant, the full movement ledger, and transfers to another account by email. |
Grounding modes
grounding_mode decides how your history becomes the labelled examples the model learns from — the single biggest lever on result quality.
| value | what it does |
|---|---|
business_led(the default) | Your business description is compiled into an economics adapter for your account, your history is expanded into a grounded option grid and replayed through your economics to produce the labels. The replayed profits are then reconciled against the realized profits you sent: if they disagree beyond tolerance the fit fails with feedback naming the mismatch, rather than quietly training on wrong labels. Runs asynchronously — /fit answers status: "grounding" and the same poll loop covers the extra phase. |
client_grounded | You ground the history. Every historical option row carrying a profit is published with that value verbatim; nothing is derived — no replay, no adapter, no LLM, no grounding charge. Use it when your own systems already value the options you did not take. |
Repeat business-led fits reuse validated grounding code automatically when the account, the exact business description and the parsed schema all match. Fresh-data validation and the model fit still run; a cache hit is an optimization, not a free run. The legacy internal mode is retired.
Model versions, and other knobs
Every fit runs against a released model version, chosen with the optional top-level model field. At the time of writing GET /v1/ offers default (the current recommendation, aliasing rc012), r003-alpha-ray, rc012 and rc012-ray. An unknown version is rejected with 422, and the list on GET /v1/ is always the live one.
rc012— multiverse candidates chosen for variety across ten quality metrics instead of by a pareto front; selector thresholding is target-calibrated, with a zero-take classifier gating predictions.rc012-ray— the same selection and thresholding on a ray-distributed fitting backend: faster on large menus.r003-alpha-ray— the older pooled small-markets universe selector on a distributed backend.
confidence_correction (number in [-1, 1], default 0.0) is a small signed adjustment on top of the model's own calibrated selector threshold: positive means fewer, higher-confidence selections; negative admits more scenarios at the cost of confidence. Typical values are ±0.1. The correction is fixed at fit time, but the response's confidence sweep reports what a grid of other corrections would have selected and earned, so you can choose the next one without paying for exploratory runs. The old absolute confidence_level parameter is retired and returns 422 with a migration hint.
"mock": true runs fit input parsing and validation with an API key but no grounding, compute or billing, and plays the real lifecycle back on a short timer. Every mock response is stamped "mock": true with a mock_note: the numbers are deterministic placeholders derived from your own task menu, never predictions.
Tables travel as JSON lists of records or as base64-encoded Parquet. Usage is metered in tokens (1 token = $1): a membership's weekly plan credits pay first, then the token balance — pay-as-you-go tokens any account can buy from $15, which never expire. Registration is free; calling the model needs tokens.
Published results
Synthetic stress test · controlled benchmark markets with known ground truth. These demonstrate mechanism, not live profitability.
| result | what it is |
|---|---|
| 0.9266 AUC → −$417.4k | The conventional baseline's great backtest, then reality. A tuned XGBoost classifier scored 0.9266 ROC-AUC on the business-observed holdout and showed +$61.7k in naive observed-data evaluation — then lost $417.4k applied to the full 20-week future opportunity menu it had never been forced to refuse. |
| +$2,250 on $4,146 | P34 on the withheld week-80 menu, through this REST API: 115 trades selected, +$2,404 predicted, +$2,250 realized. The calibrated XGBoost baseline selected 177 trades and realized −$8,789 on $18,821 deployed. |
| +$14.8k vs −$219.8k | The difficult benchmark — partial observability, selection bias, regime change, optimistic backtest traps — P34 against the tuned conventional baseline. On the easy stationary/growing benchmark P34 preserved the upside instead of trading it away for safety: +$228.6k against the baseline's +$227.1k. |
| 99.4% | of evaluated orders rejected in the published study. Disciplined refusal is the central mechanism: no-trade is a rewarded output, and false-positive control is explicit in the model class. |
Live deployments · company-reported, not audited by a human licensed auditor.
| result | what it is |
|---|---|
| $30M+ | sales generated for customers with more than 95% of trades unsupervised, cumulative since 2023. |
| ~$100M/yr | reseller operated with limited supervision: thousands of signals, POs and shipping orders generated. |
| 3,000+ | loans issued by the model in a live micro-credit test, 2025. |
Methodology, notebooks and the falsification protocol: the technical report (P34: Learning When Not to Trade, June 2026), the August 2026 working paper Computable Markets: Business Menus, Sales Event Tapes, and Cross-Market Profit-Directed Learning, and the research page, which keeps synthetic and live evidence separated. The research site is computablemarkets.com. Historical results do not guarantee future outcomes.
Quick examples
Runnable
Two complete programs ship in the docs repository:
examples/client/— the sample client end to end: build the sheets, submit, poll, print the portfolio.examples/baseline_comparison/— the same synthetic market decided twice, by a gradient-boosting regressor trained on the labeled rows and by P34, then both scored against the simulator's true demand. Runs offline with no account for the baseline half. This is the notebook result above, in a form you can execute.
Amazon wholesale — US & EU
Reference deployment — operated in production for members today.
The founding deployment: purchase and shipping portfolio decisions from live wholesale menus, in production since 2023 at roughly $100M/yr reseller scale (company-reported). Menu: SKU × quantity × supplier offer, with lead times and fees. Data: supplier price lists, catalogue and fee data, sales velocity, returns.
Hard to operate. This is the best-understood market on the list and one of the hardest to enter — and the hard parts are not the model. Amazon account management (ungating, brand and IP complaints, performance metrics, suspension and reinstatement) and wholesale supplier relationships (winning authorised distributor accounts at all, minimums, credit terms) are demanding operating problems P34 does not solve. Enter it because you already run it, not because it is the developed one.
Micro-lending — individual
Active experiment — validated in live tests; deployed under review.
Lend / no-lend calls where credit history is sparse or absent; about 3,000 loans issued in a live model test in 2025. Menu: applicant × offered principal × term. Data: application attributes, the repayment tape, collections outcomes. Regulated commerce: gated behind market-specific compliance review, and regulated-market uses sit in a separate perimeter under the API terms.
A first market, where the loop closes in days
Market blueprints — structure fits, no maintained workflow ships yet.
The purest computable structure available to one operator: public comparable-sales data, enumerable listings, small units, fast settlement.
| market | menu | data |
|---|---|---|
| Expiring domain drops | dropping name × bid | GoDaddy / Dynadot auction and sales history |
| Vinyl records | pressing × condition × price | Discogs sales history |
| Retro games and consoles | title × condition tier × quantity | PriceCharting time series |
| Retired LEGO sets | set × sealed/used × quantity | BrickLink price guide and sales |
| Trading cards — sport and TCG | card × grade × quantity | TCGplayer, eBay sold, PSA population reports |
About $10 units and 500-name portfolios with instant settlement and zero shipping, in the case of domains; the finest public comparable-sales dataset in any collectibles market, in the case of vinyl. Start where the loop closes fastest and the barriers are lowest, prove that the data can be collected quickly and that deals execute end to end, and only then carry the same mechanism into larger and longer markets with more capital and more complex participation rules. That order is not negotiable: scale without those two is a plan, not a demonstration.
More examples
Sixty-nine markets are catalogued with their states at hyperc.com/markets.html — machine-readable at /markets.json — from institutional scale down to the ones a single operator can claim this week: electricity and compute capacity, freight and mobility, industrial surplus and production capacity, contract work and recovery, virtual goods and game items, used cars, construction materials, retail real estate. A state is an evidence level, not a claim that a workflow ships: most of the catalogue is a blueprint, and a listing is not a recommendation. Which one should you point P34 at? The market you already operate in, or one you know well — the model's usefulness comes from your data, your constraints and your operating knowledge.
The scale test
The place where the theory matches reality is one specific kind of market: the reject market, also called the market of computationally prohibitive deals. These are markets where ordinary players reject deals not because the deals are bad, but because each outcome is uncertain and filtering the good ones out of the flow is computationally hard — too many candidates, too many interacting variables, too little certainty per deal for a human or a rule of thumb to work through. The deals sit there, enterable and untested.
One property carries the whole argument: there are thousands of those deals. Nobody rejects deals for being too many to evaluate when there are ten of them. So look at the menu you are about to send — if it does not hold at least hundreds of candidate deals, something is wrong, and it is one of exactly three things: it is the wrong market; the agent or scraper assembling the menu is finding a fraction of what the market shows; or whoever built the menu decided that a handful of probable deals, scored by hand, was enough. It is not. A handful of hand-evaluated deals is not a P34 workflow — it is the workflow P34 replaces. Nothing on the server enforces this; a ten-row task menu passes every check. The scale test is on you.
Explanation
The hard part of biased-data problems isn't fitting the data — it's the chain of engineering judgment calls made to compensate for the bias: feature treatment, regularization, conservatism assumptions. Different choices produce very different models, and the one that fits history best is usually the one that's most over-optimistic on real markets.
P34 treats that space of engineering choices as the problem itself. We enumerate the choices as large, sparse unrolls and score each configuration by a survival criterion: across grounded simulations and real market history, did it avoid losses, stay comparable to the business's prior performance, and stay close on portfolio-level profit predictions? The final-layer weights are trained against a lifted proxy loss so the model selects the configuration that survives across scenarios — not the one that fits the past best.
Why the approach works on these markets and not on exchanges: a computable market is a business market, whose inefficiency exists by design. The business has to operate a process — sourcing, holding, fulfilling, collecting cash — so the options on the menu are specific to that business, and the inefficiency is structural enough to persist over months and years. On a regulated exchange the instrument is identical for every participant, there is no operating process to exploit, and an edge, once discovered, is arbitraged away almost immediately. The data tells the same story from the other side: P34 is built for indirect, partially observed signals — a sales rank, a stock-out flag, a category trend — and exchange-grade transparency is precisely what makes exchange inefficiencies vanish.
Limitations
- The entire historical menu must be provided. The model does not speculate about what the past and the missed opportunities looked like.
- The business must have had more options historically than it chose — otherwise there is no policy-selection signal. A history in which every outcome is known is refused.
- P34 is for computable markets; it does not yet automatically prove that a market is computable.
- If the deployment-time menu is far from the training context, an explicit refusal path is not yet exposed.
- Latency runs from under a minute to hours. P34 is slow by design and exploits inefficiencies of partially observed markets where the data mostly exists in latent space. It has no value in regulated, fully materialized (e.g. where a historical order book exists) or high-frequency environments.
- Generalization across all markets is not fully known; pilots proceed through shadow testing and controlled deployment.
- Unknown unknowns remain — P34 is an early release in a new model class, and the platform is in beta.
Terms
The services are provided for technical research, engineering evaluation, and discussion purposes only. They do not constitute investment advice, financial advice, trading advice, a recommendation to buy or sell any asset, or an offer to provide investment-management services. HyperC does not guarantee profit, positive returns, loss avoidance, model accuracy, live-market performance, or suitability for any particular market, business, trading strategy, or investment decision. All benchmark results shown here are experimental and may not generalize to real-world deployment. Any use of P34 or related PARML methods in a live business or trading environment requires independent validation, risk controls, compliance review, and professional judgment.
P34 outputs are model-generated decisions that operate only under the objectives, constraints and controls you configure. The API does not place orders. Securities, derivatives and prediction markets sit in a separate regulatory perimeter, and regulated categories are reviewed under the membership terms.
Access and pricing
Registration is free and self-serve at the management console; POST /validate needs no account at all. Model fits require an active membership, which carries the workspace, the market tools, the token allowance and the community. Current plan details are on the pricing page, and what the membership contains is on the membership page. Governed deployments inside an enterprise operating envelope are the enterprise track.
Authors

The HyperC team.
© 2026 HyperC (CriticalHop Inc)
+1 650 388 94 99
Santa Clara, CA
info@hyperc.com
Get an API key | Contact | Join us